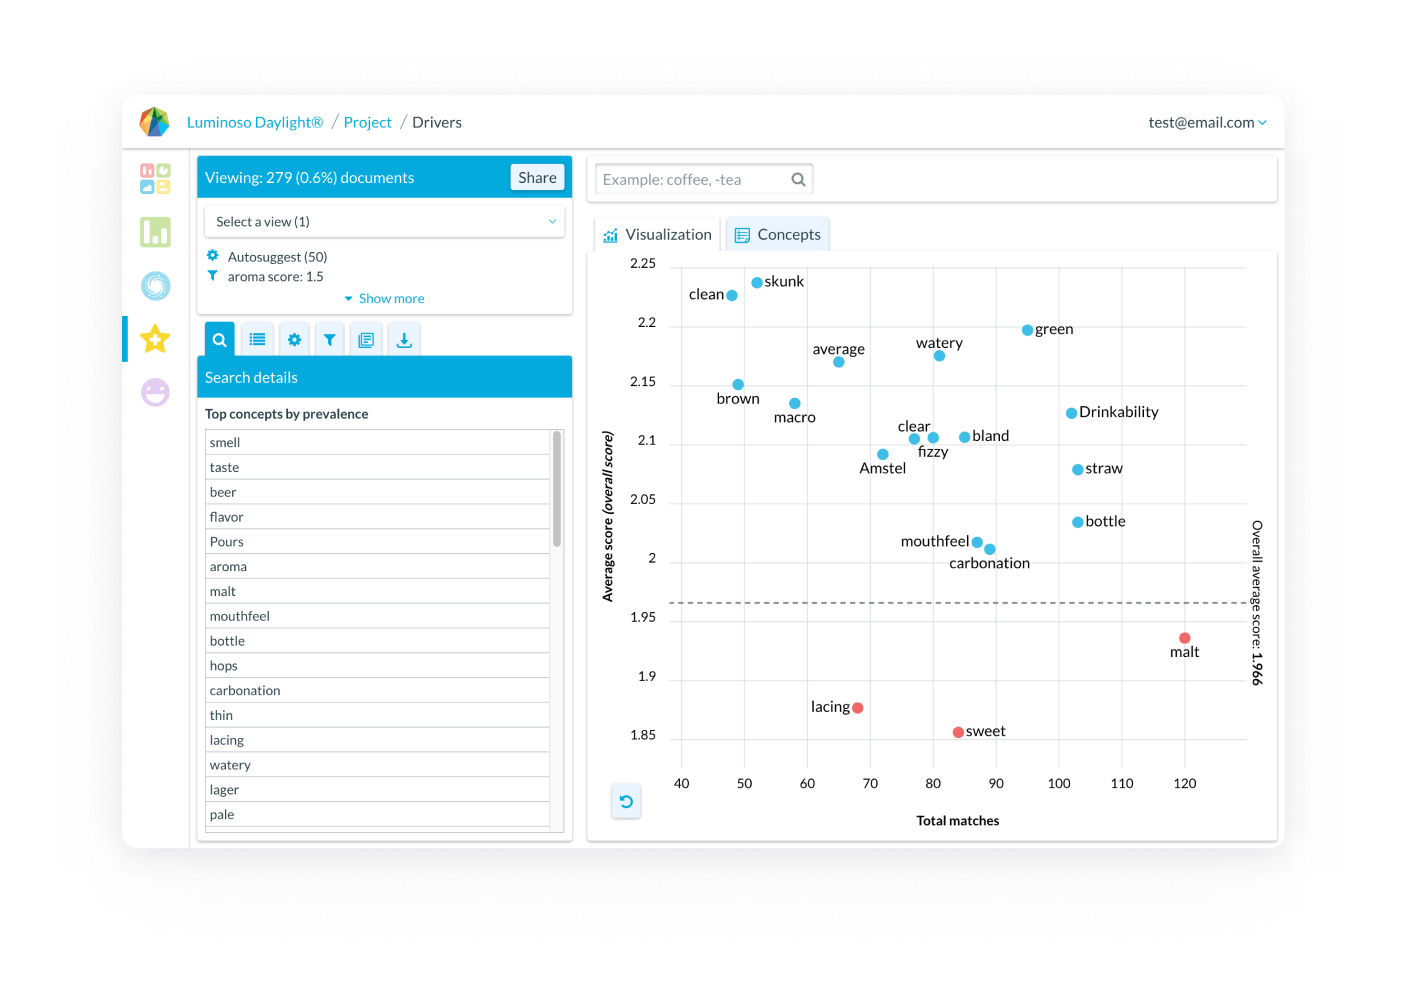
In the Drivers feature, view how your structured numeric data relates to unstructured natural language concepts and reveals why scores increase or decrease. See how concepts in subsets of your data raise or lower overall satisfaction scores for your product. The graph allows you to identify trends in a glance, and the filtering criteria allow you to laser-focus for deeper insights.
- Display the Drivers feature: Click the Drivers icon in the sidebar or select Drivers feature on the Highlights page.
- Use the arrows at the top of columns to change the order of your concepts and use options in the Configure visualization tab to adjust how concepts are displayed
- Use the Filter documents tab to apply filters to your visualization. The average score line, which runs horizontally across the graph, updates as you change your filter criteria.Note: You can’t use the value you selected as a score as a filter.
- Use the cursor to zoom in and out on the concepts you see in the graph.
- Click on a concept’s colored dot to see more details about it. The concept opens in the Concept details pane.
To use trend analysis in Drivers
- Open Daylight and select the Drivers feature.
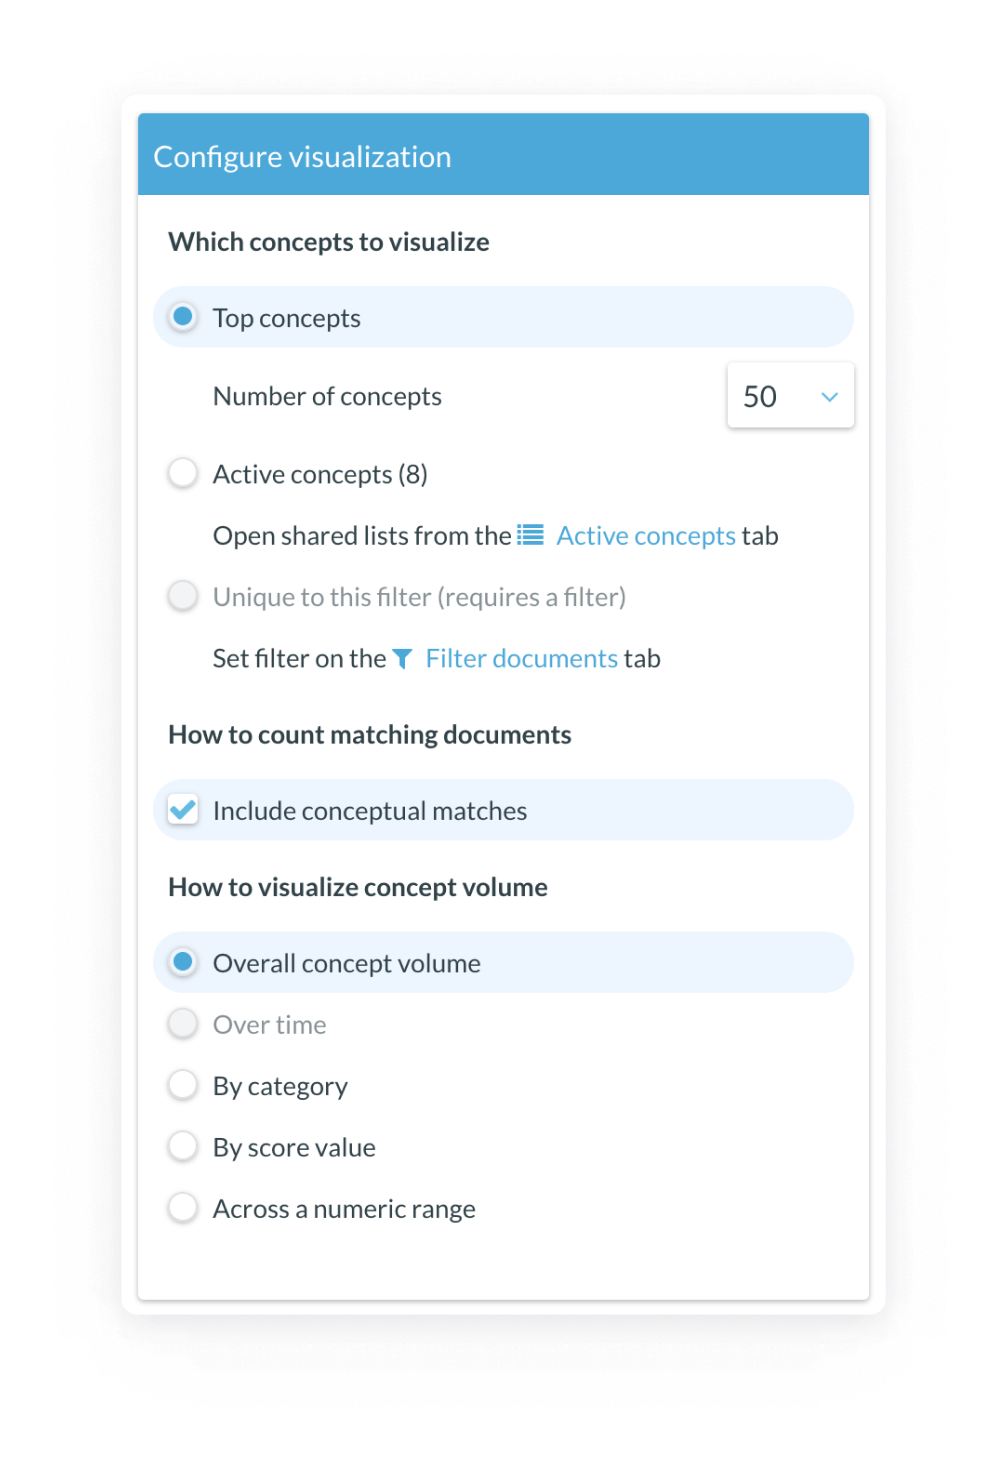
- In the Configure visualization tab, select a score field from the menu.
- Choose Autosuggest, Saved concepts, or Unique to this filter from the Which concepts to visualize section. Concepts that Daylight identified as strongly influencing your score are auto suggested. Alternately, save concepts that are relevant to your business to view them in Drivers. Finally, use the Unique to this filter option to identify auto suggested concepts that are uniquely relevant to any filters you’ve applied, as compared to the rest of your dataset.
- Click the pencil icon next to Select date field to compare periods and select your desired date field from the menu. The visualization splits into two scatterplots. The top scatterplot automatically displays the full date range for the filter you applied.
- Refine the date range in the top scatterplot to an interval you’re interested in. The bottom scatterplot automatically identifies and displays the same size time interval ending a day before the interval you selected for the top pane. For instance, if you selected a 10-day interval of time, the bottom scatterplot would display the previous 10-day interval.
- Change the date interval in the lower scatterplot, if desired. Each scatterplot displays the most relevant auto suggested or saved concepts for that period of time.
To configure Drivers concepts using the concept tab
As part of this change, we also introduce a Concepts tab at the top of the Drivers visualization. Use this tab to select the concepts you view in the single drivers visualization, or independently for the top and bottom comparative visualizations.
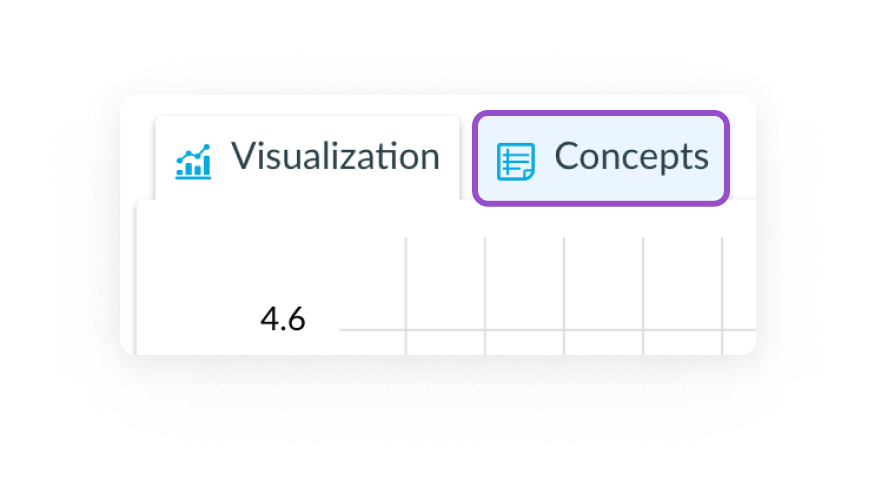
- Click the Concepts tab. It opens a list of concepts that match whatever score field and type of concepts to visualize you selected, sorted by absolute difference.
- Configure the concepts to match what you want to see in the scatter plot visualization.

- Click Visualization to reopen the Drivers scatterplot and view your selected concepts.
- Make sure the Drivers visualization is showing the dates you want to use, and that you’ve selected either Autosuggest or Saved Concepts in the Configure visualization.
- Click Concepts (Above) or Concepts (Below) to edit the concepts you view in each scatterplot. Depending on your needs, you may wish to view the same or different concepts in the top and bottom panes. Sentiment feature: Identify positive, negative, and mixed sentiment.