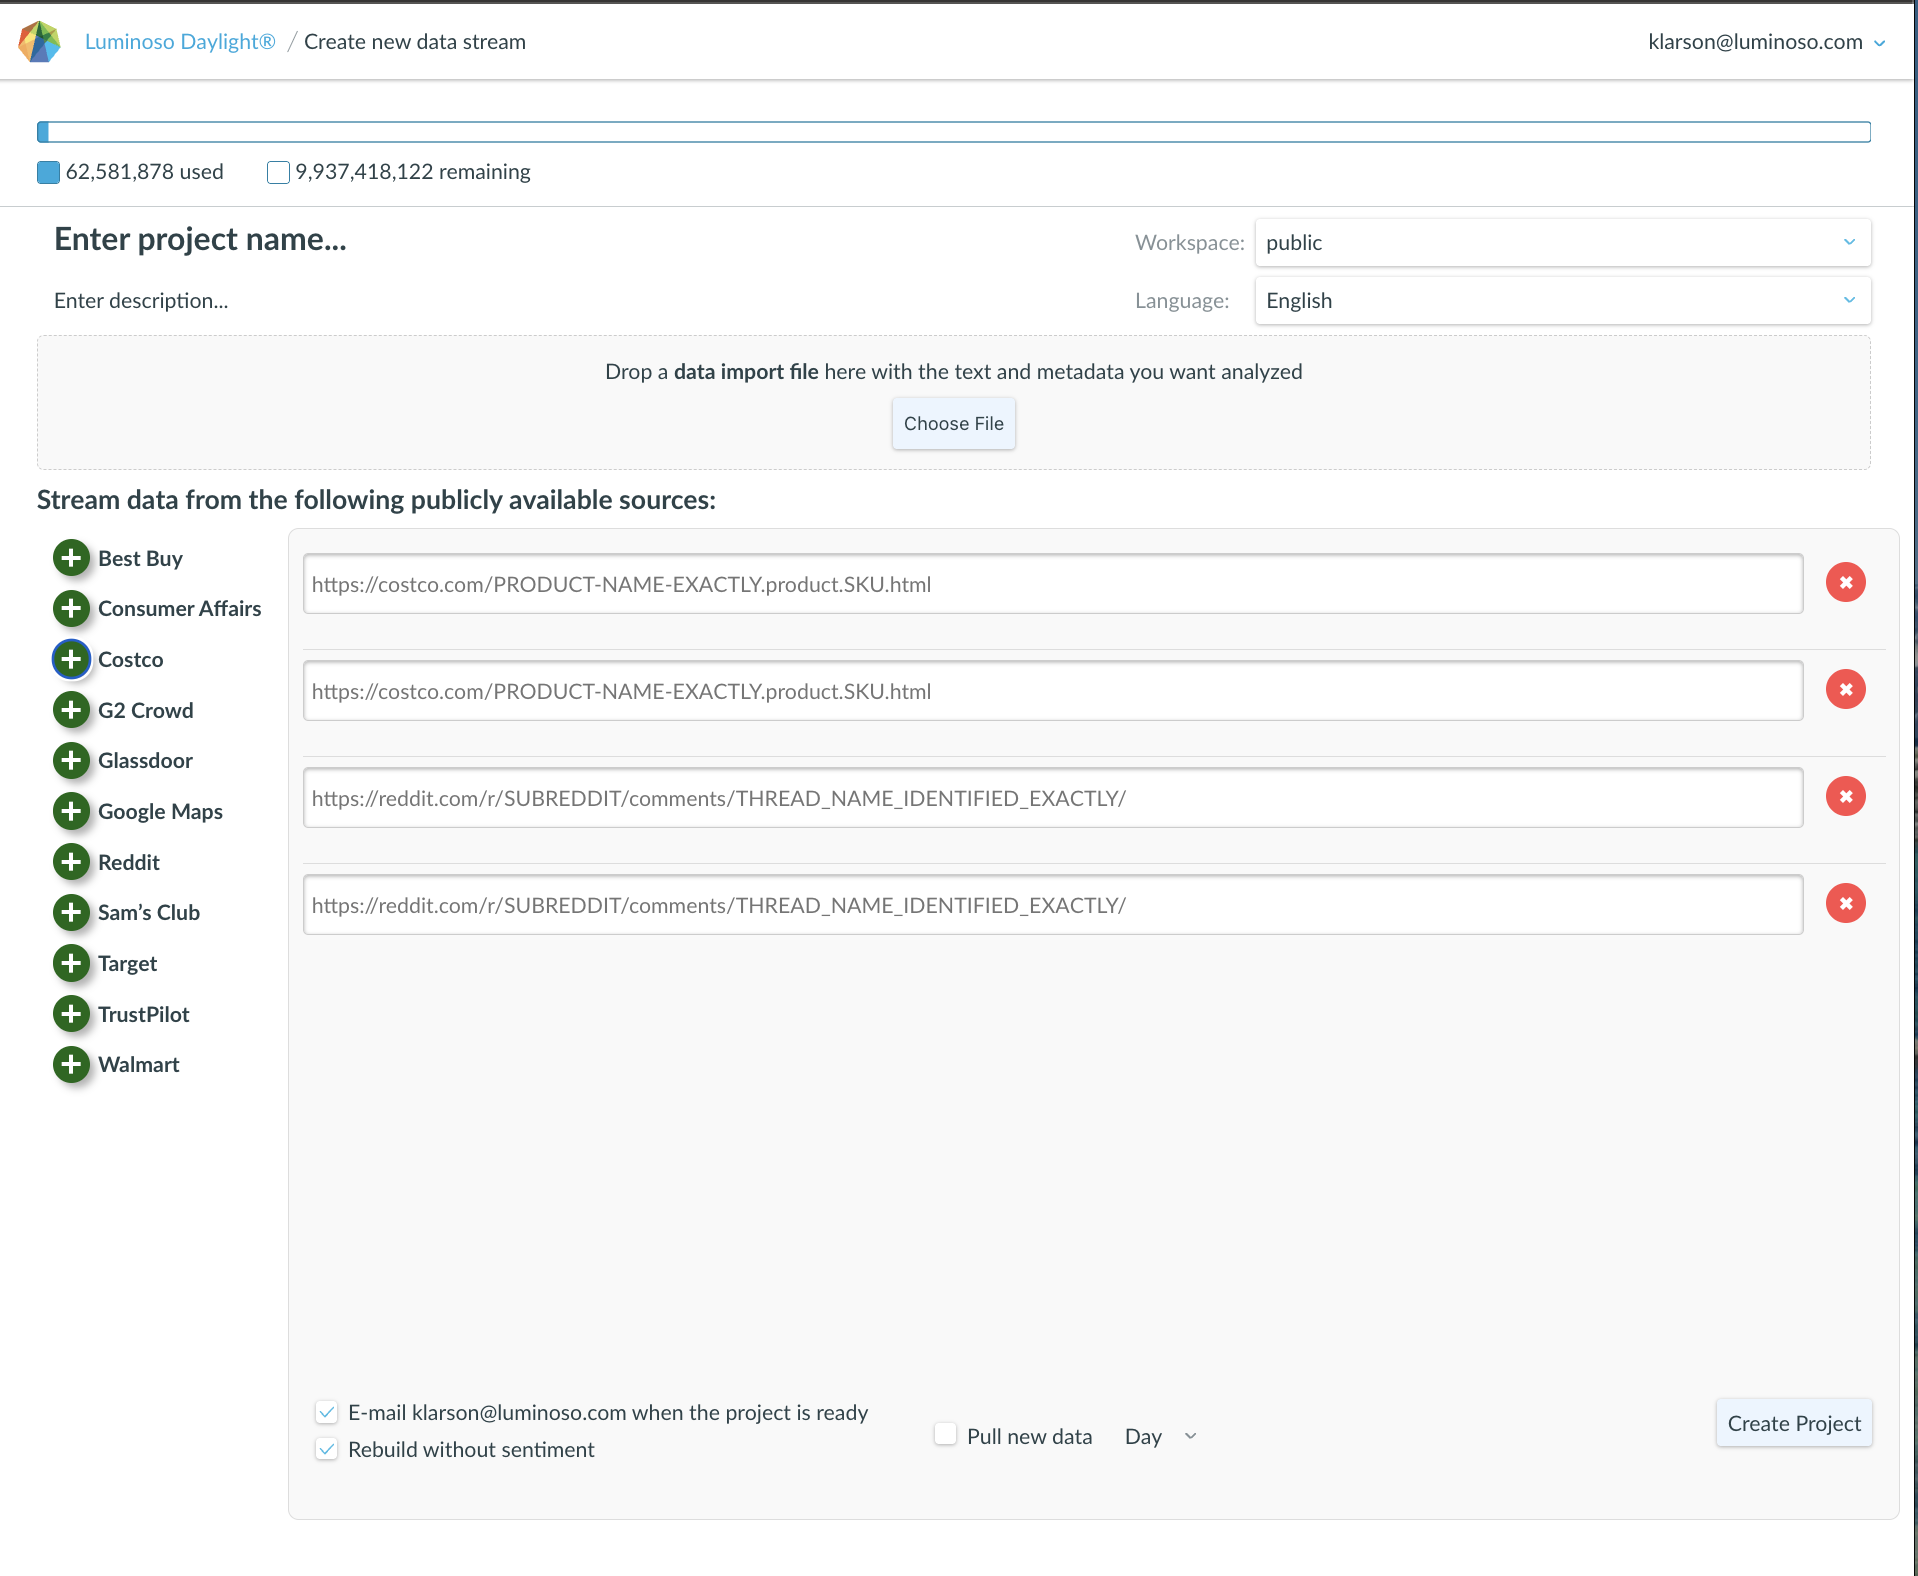
To upload a file and create a new Project, go to the Project page and click on the New project button on the top right corner of the page. You can get to the Project page by clicking the Luminoso logo or “Luminoso Daylight” on the top left of your screen. From this page, you can select a file to upload by clicking Choose file or by dragging and dropping a file onto the main panel on the page. Note that you can only upload 1 file at a time. Once a file has been selected, you will see a preview of your data which will look similar to the image below.
Document Usage Meter
The document usage indicator at the top of the page shows document usage relative to the contracted document allotment for your organization. Prior to selecting a file to upload, you will see the licensed document amount and the currently used document count. Once a file has been selected, you will additionally see the number of documents that the selected file will use out of the allotment.
Project Info section
The Project Info section consists of the Project name, Description, Workspace and Language.
- Project name — defaults to the name of the uploaded file and can be edited
- Description (optional) — can be used for information about the project
- Workspace — defaults to whatever Workspace you were using when you clicked New project. If you have multiple Workspaces and prefer a different one, you can change it here.
- Language — there is no default language selected. You must select one of the 15 available languages.
Data Summary panel
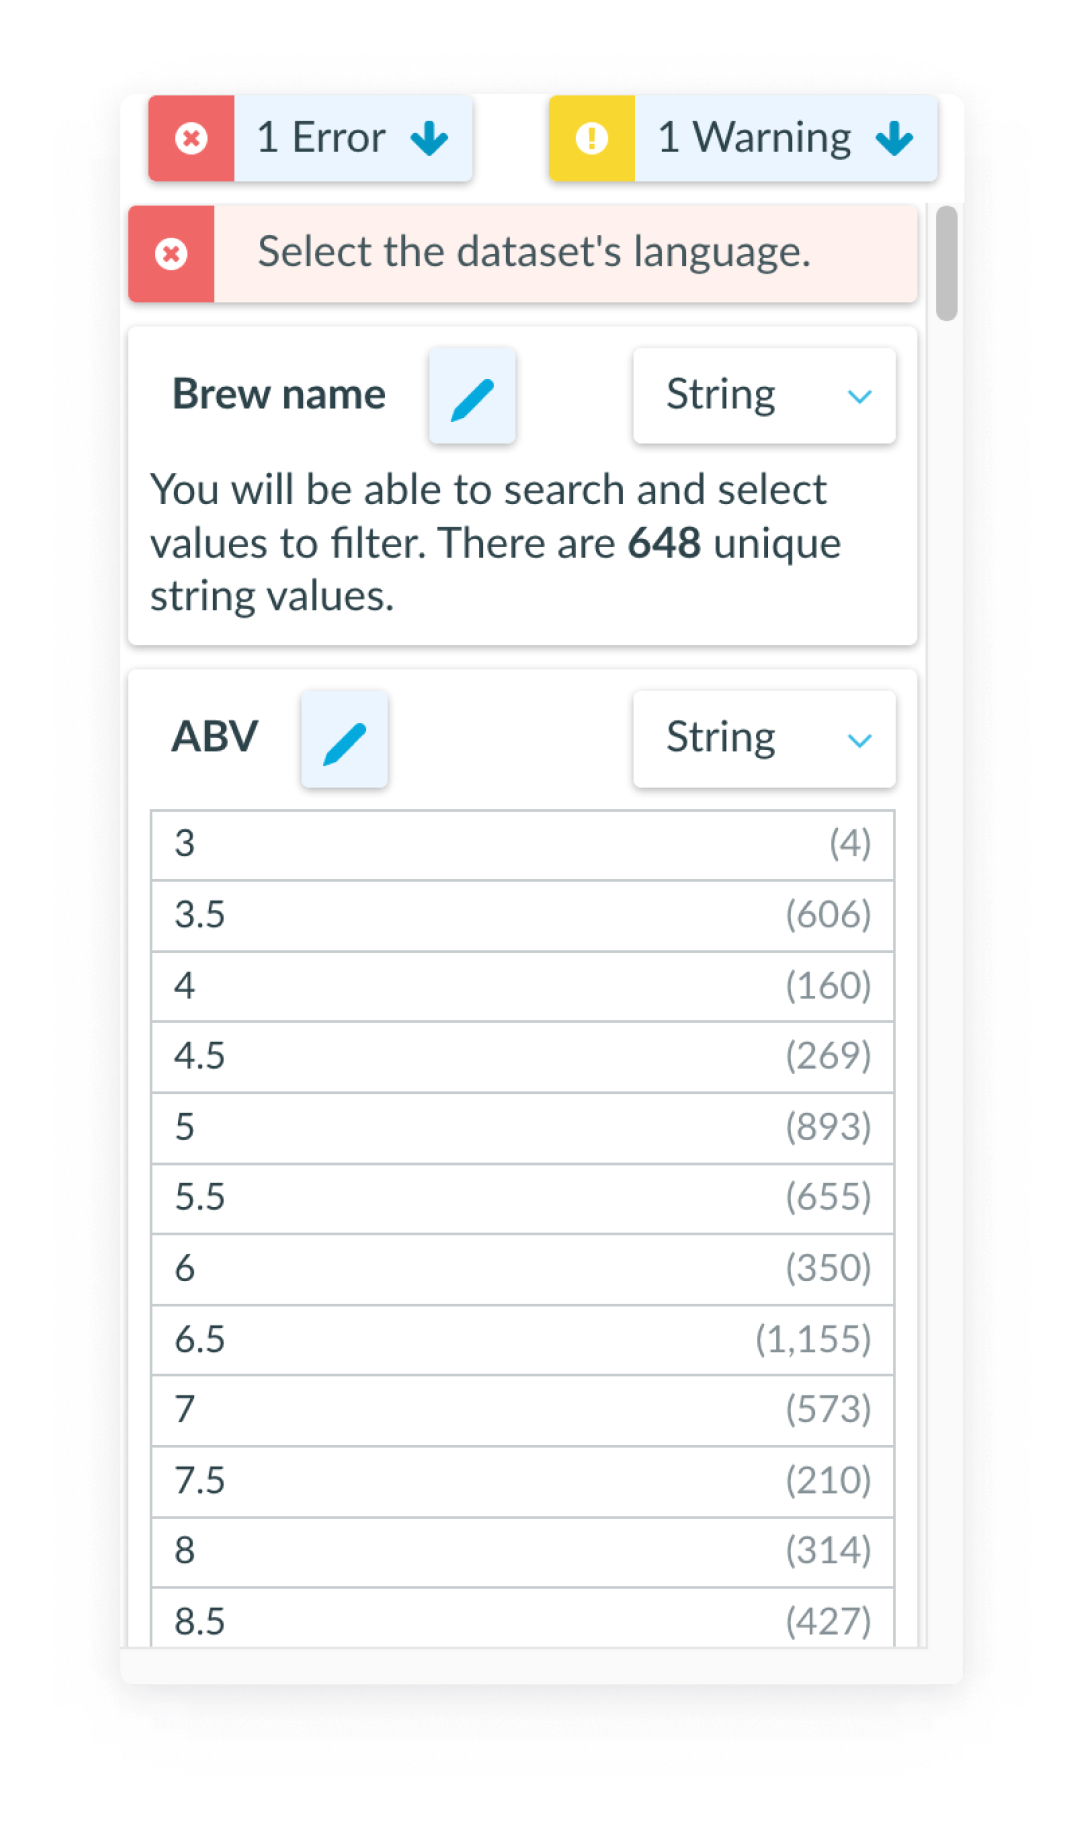
The Data Summary panel along the left side of the page is where you can designate the data type for each column of your data. There will be an element in this area for each unique column header name. If there are multiple columns with the same column header name, there will only be one element here corresponding to that group of columns.
Use the drop down at the top right of each element to designate the data type. A default value will be set as follows:
- If the column header is formatted as described in the Data Fields section, then that information will be used to set the default. For example, if one of the column headers is named “text”, the default for that column will be set to Text. Or if the column header says
date_ResponseDate, the default for that column will be set to Date. - Otherwise, the data type will default to String.
Each element will also provide information about the values found in that column in the context of the designated data type. For metadata columns, a preview of how this data will appear in the Filters after upload will be shown.
Clicking on an element here will scroll the Data Display panel to bring the corresponding column into view and highlight the column.
Data Display panel
The Data Display panel shows up to the first 100 rows of the data. This can be used as a reminder of the contents of a column as you’re deciding on the data type designations.
Clicking on a column in this area will scroll the Data Summary panel and highlight the corresponding element.
Editing Column Header names
As described in the previous section, the first row of the uploaded data will be used as the name associated with data in each column. You can change the name of any column by clicking on the edit icon next to the column name in either the Data Summary panel or the Data Display panel.
Combining columns
When multiple columns have the same name, they will be combined into a single data field. You can edit column names to combine columns or separate combined columns.
Errors and Warnings
At the top of the Data Summary panel, a count of Errors and Warnings found in the data will be shown. Errors must be corrected before the project can be created. Warnings are things you should take a look at, but will not prevent you from creating the project. The Create project button will not be enabled until all Errors have been corrected. The counts shown will change as Errors and Warnings are corrected or new ones introduced.
Errors and Warnings that apply to the entire project will be shown just below the Errors and Warnings counts. They will be automatically dismissed as the issues are resolved.
Errors and Warnings specific to a column of data will be shown in the corresponding element in the Data Summary panel.
Note: some Errors and Warnings cannot be resolved within Daylight. In this case, you will have to make edits to your CSV file and upload the newer version.
Complete the upload
Once you have filled in the Project Info section, confirmed the data type designations, corrected all Errors and reviewed the Warnings, you can complete the upload process by clicking the Create project button on the bottom left. Just above the button, you will see a checkbox if you would like to receive an email when the analysis has been completed and the project is ready to be viewed. It is checked by default.
Uploading to an existing project
The steps described in this section can be used to upload additional data to an existing project as well. To do this, click Upload data from either the Project’s Highlights page or within the Project tile on the Projects page. When there are mismatches between the data field names in the project and the column headers for the data being uploaded, Warnings will be shown to highlight these mismatches.