In Q2, our team at Luminoso is honing in on enabling our users to be more precise and granular with their Daylight insights. Following Q1’s focus on quick summaries and transparency, users may dive even further into their topics of interest.
Along the way, expect more streamlined user workflows as functionality is consolidated into more intuitive views, reducing the number of clicks required to accomplish workflow steps.
Daylight Application
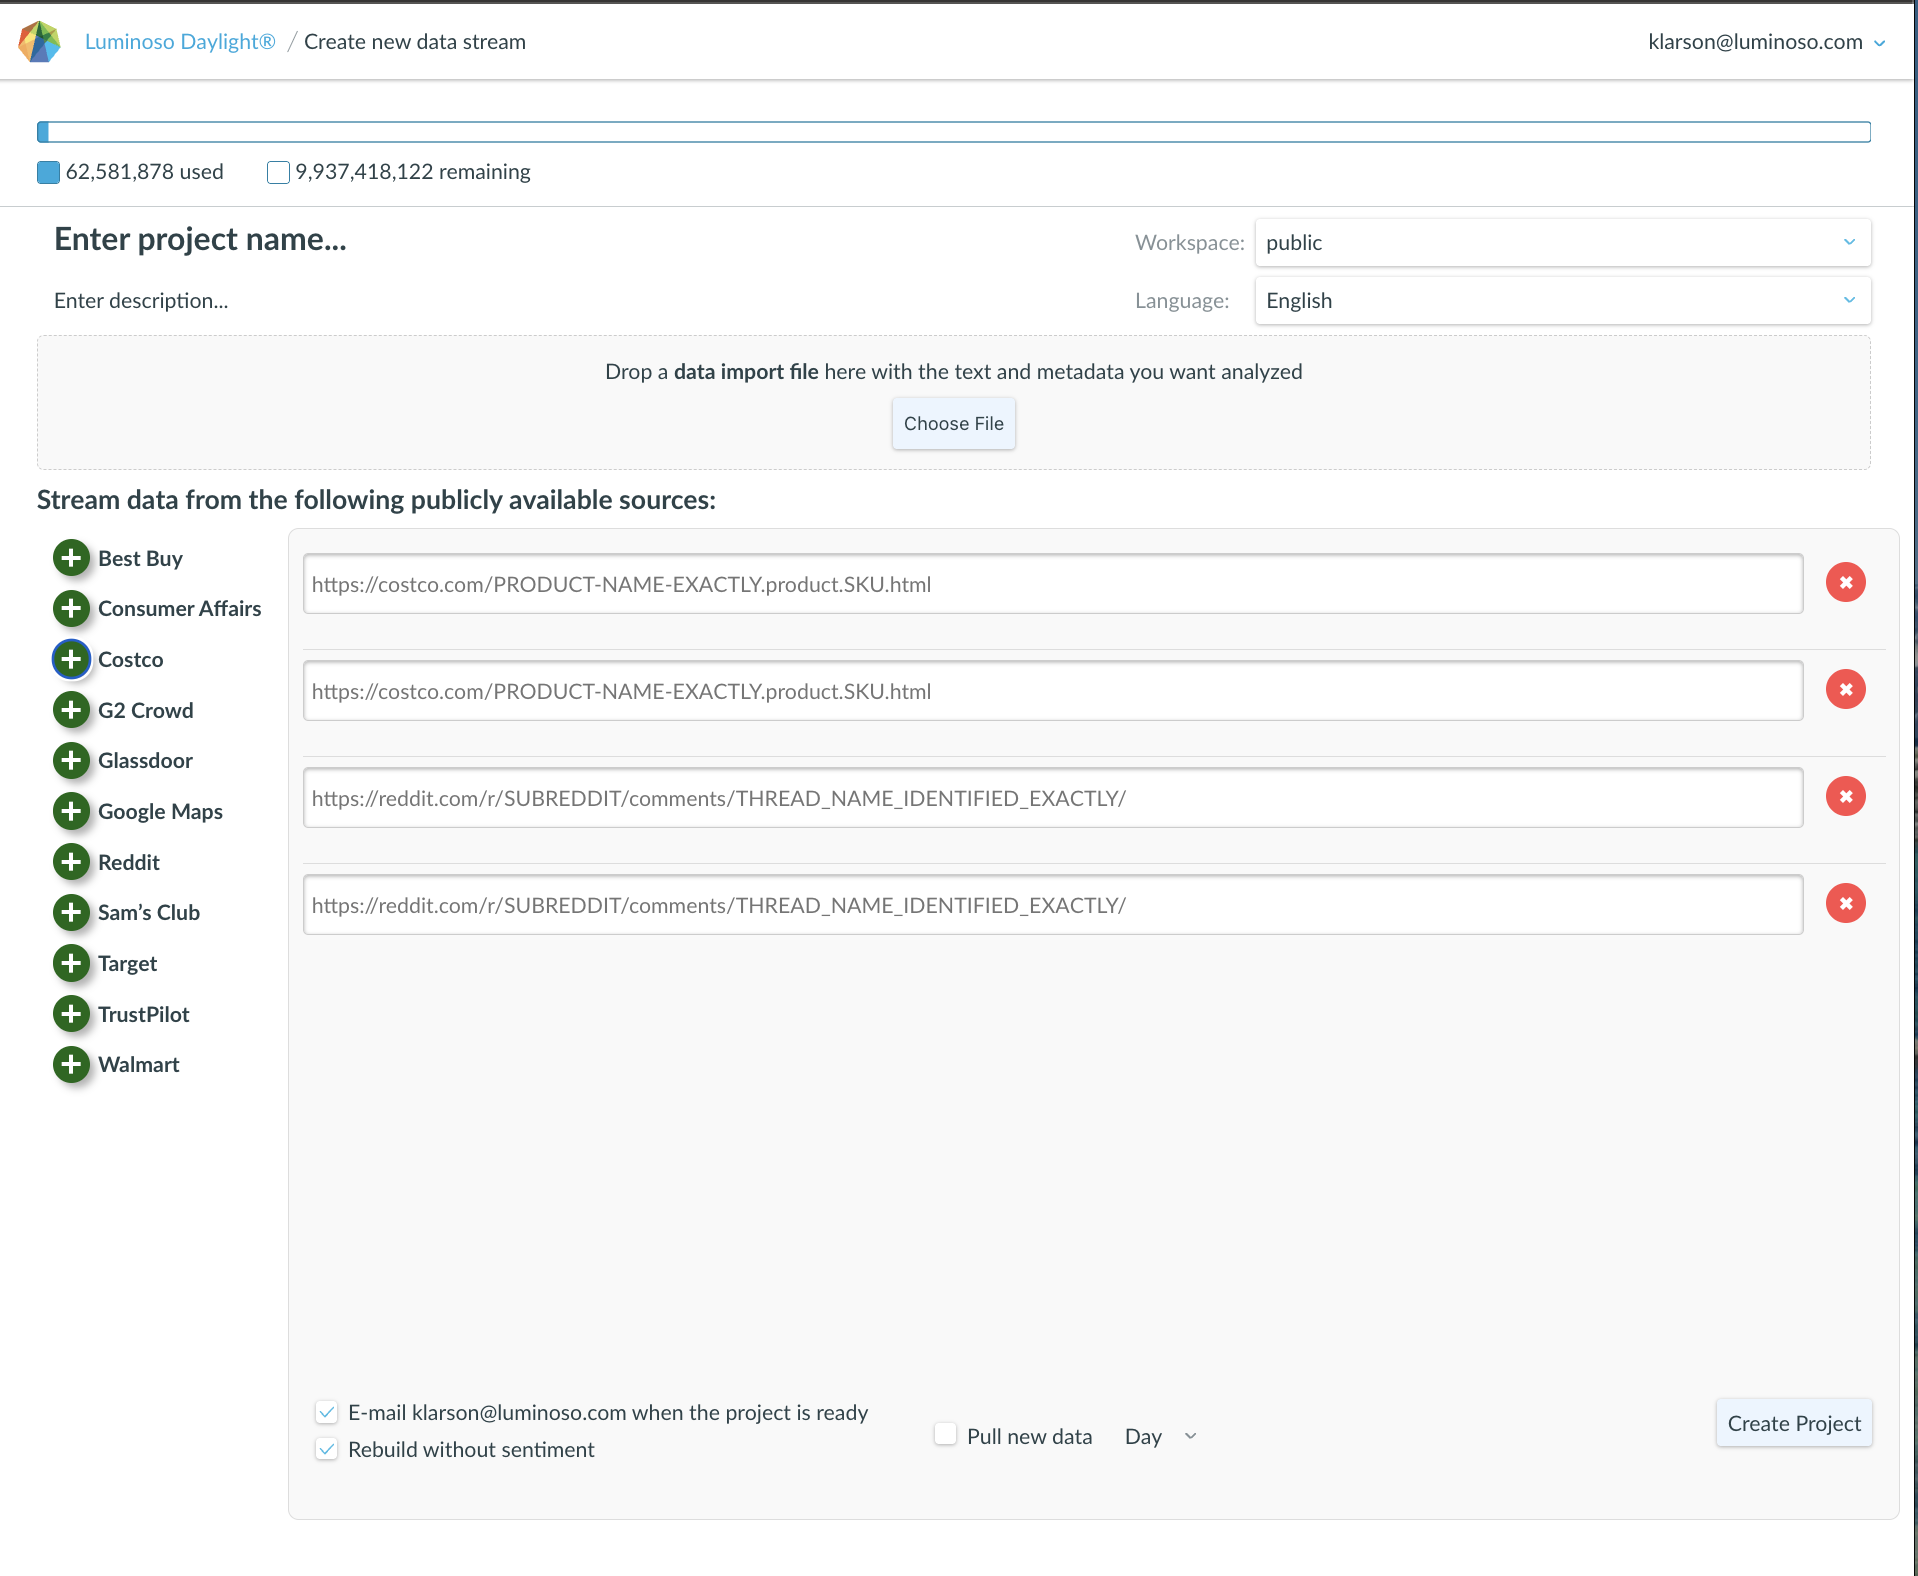
Streamlined Data Upload
Whether users need to upload a survey or pull in public data like discussions from Reddit or Glassdoor, users can now do that from a single upload page.
- To create new projects, click “+ New Project”.
- To add new data to existing projects, click “+Add data” from the project list page

Users with Administrator or Creator roles may also “+Add data” from the project management pages. The project managment buttons have been removed from the Highlights page to keep that page focused on the insights.

When users are setting up a project or adding new data to an existing project, the new page appears like this:

Surveys and other data import files can be dropped in the top section. The bottom section is designated for data streaming set up.
AND Concept Definitions with ‘&’
In addition to the OR concept definitions using ‘,’ which expand the concept search to include documents that include any concepts within the search bar, Daylight supports AND concept definitions using ‘&’, which narrow the concept search to include documents that include all concepts within the search bar.
These are indicated with the hollow dot icons and are included in the subtheme concept lists generated by Helios, as shown below:

Aligned Left Tabs
The middle panel tabs, including Configure Visualization, Filters, Document Viewer, and Exports, have been moved to the left panel for a more intuitive user flow.
Collapsible Control Panel
Presenters and users with tiny monitors rejoice! Daylight feature insights can now go full screen with a collapsible side panel.
Export as PNG now in the Exports Tab
Find all exports in a single place, including your PNG images of the feature views with the Export as PNG at the top of the Exports tab.

Shared Views moved to Top Bar
Shared Views are now at the top of the interface in the application, just like where they’re located in the Dashboard feature. Combined with the Collapsible Control Panel, users can build presentations within the Daylight Application without revealing the analysis controls.

Concept Search moved to the Control Panel
Concept Search has been moved from the top bar to the control panel on the left to allow for a more streamlined control experience.

Directly Edit Project Name & Description
The edit and save icons have been removed from the project creation page, as users can edit the text directly in the field.

Daylight Dashboard
Dashboard Tabs
- New dashboard opens to tab with “New Dashboard” in Italics
- Once a user edits the name, then the first tab “New Dashboard” should change the name to “View 1”
- Once a user clicks +, then an empty screen appears with “Unnamed Dashboard” view
- The New Dashboard should only stay if the user has not clicked save
- The New Dashboard should have an X button that will close the tab, but the page is still accessible in the dropdown menu in the top right.
If a user assigns two dashboards with the same name, users will see the error message “Dashboard already exists”

Document Viewer
Users may customize which metadata fields are visible in the Document Viewer widget.

Users may also set their desired “Page Size” to adjust the number of comments displayed in the widget:

Drivers:
The Drivers widget now includes table and scatter plot chart types:

Drivers over Time Options
Drivers over Time can be displayed as a single line graph, or as a faceted “multi-chart” using Chart Type.

Impact Score Widget
The Impact Score widgets use a calculation specifically for product reviews.
Learn more about the calculation here.

(new!) Impact Score Comparison
Impact Score Comparison widget allows users to visualize Impact Scores in clear strengths and improvement columns:

Sentiment Share
This dashboard widget allows users to select Concept Lists and see sentiment distributions as well as generated summaries for comments with negative and positive sentiments.

Qualitative Metadata Breakdown
This dashboard widget allows users to convey metadata as simple stacked bar charts, pie charts, donut charts, as well as horizontal and vertical bar charts with custom sort options.

Segment patterns have been introduced for metadata fields that have more than seven values to improve differentiation for viewers:

Largest Net Sentiment Movement
This dashboard widget allows users to monitor sentiment changes for concept lists across time. The widget also contains summaries for the current period (baseline) and the previous period (comparison).

Share of Voice Over Time
Share of Voice over Time can show the share of voice within a filtered subset or by total documents.

Largest Concept Movement
This dashboard widget allows users to monitor the frequency of mention changes for concepts within a determined concept list across time. The widget also contains summaries for the current period (baseline) and the previous period (comparison).

Largest Drivers Movement
This dashboard widget allows users to monitor average driver score changes for concepts within a determined concept list across time. The widget also contains summaries for the current period (baseline) and the previous period (comparison).

Overall Sentiment Breakdown
This dashboard widget allows users to view overall sentiment breakdown as simple stacked bar charts, pie charts, donut charts, as well as horizontal and vertical bar charts.

(new!) NPS Score over Time
NPS Score over time allows users to determine their time frame of interest (weekly, monthly, quarterly, etc) and calculates the NPS score using the standard NPS formula: promoters – detractors)/total responses with promoters defined as scores 9 and 10, and detractors as scores 0 through 7.

Helios Themes Default
If a project has:
1. Generated Helios themes and
2. The widget has a concept lists option; like the Drivers widgets below,
Then – the default concept lists will default to the Helios themes:

Helios Summaries available through our API
Summaries in Dashboard widgets are now available for export using the Daylight API so you can put integrate Luminoso summaries and insights into platforms like PowerBI, Tableau, and more.