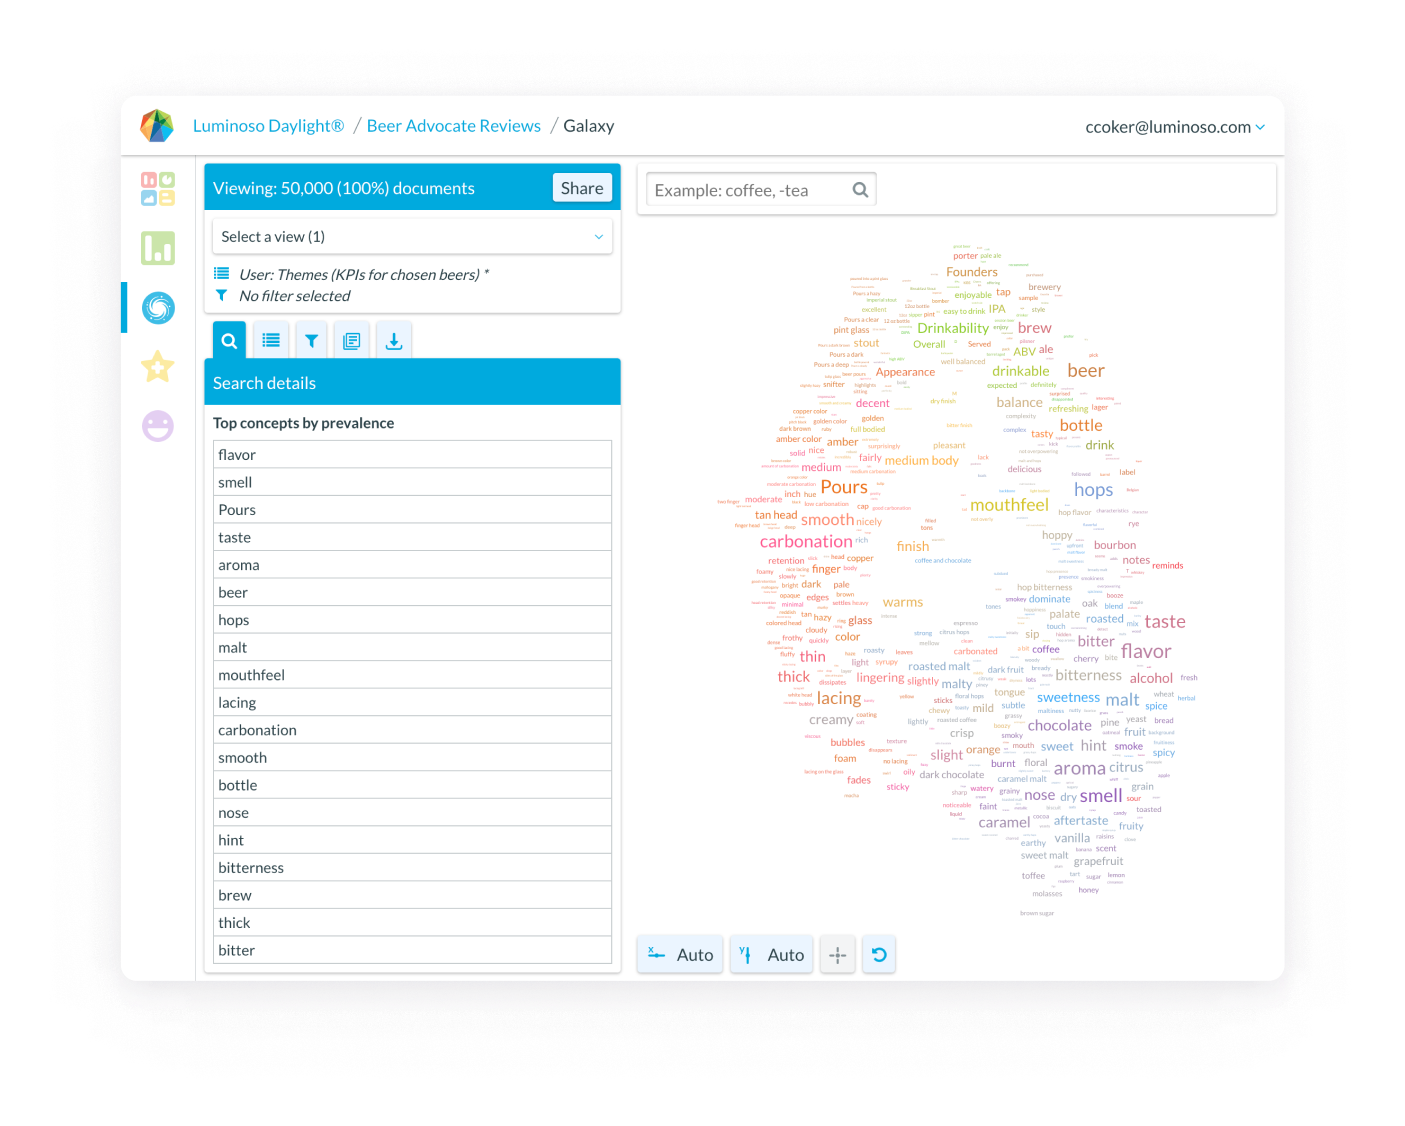
Use the Galaxy feature to see how strong conceptual relationships are in the context of your entire project. The size of a concept in the visualization indicates how relevant it is in the project. Related concepts cluster together by theme. Since the view is dynamic, you can drag concepts in the space to realign the axis. Highly related concepts group more closely while less related concepts rotate away.

- Display the Galaxy: Click the Galaxy icon in the sidebar or select Galaxy feature on the Highlights page. The Galaxy opens.
- Use the Galaxy as a visual overview of your data. Click, hold, and drag a concept to rotate the Galaxy and view the 300 dimensions the Galaxy contains. As soon as you stop holding the concept, the Galaxy collapses and displays as two-dimensional again, although it is now reoriented.
- Click the reset button to restore the Galaxy to its default orientation.
- Click the X and Y axis icons to orient the Galaxy around specific active concepts. If you haven’t saved any concepts yet, you can’t use this option.
- Once either the X or Y axis are set, the grey axis toggle button turns blue. Click the button to turn on the axis label. When selected, the button is green.
- Click the Active concepts tab to view specific concepts. If you haven’t saved any concepts yet, this tab displays suggested relevant concepts that Daylight identified when you created your project. Daylight automatically suggests groupings of related concepts and assigns colors to demonstrate association.
- Select a concept in the Galaxy or the Active concepts pane to view its concept details.
- The concept appears in the Concept details pane and displays as orange in the Galaxy, while related concepts turn blue and unrelated concepts turn gray.
- Click the X next to the concept’s name to deselect it. The concept disappears from the Concept details pane and Galaxy’s colors return.
Create a new project from selected data
After you spend some time with your data, consider using Daylight’s learning ability to gain new insights from a smaller data set. When you create a new project from filtered data, you include only the data you selected in your filters. QuickLearn then recalculates the association between concepts, giving you new calculations that are displayed in the Volume, Sentiment, Drivers, and Galaxy features. The new project retains the metadata you added when you created the original project.
- The Create project from selected matches option is available in every feature.
- Filter your dataset to show the subset you want to analyze.
- Click Create project. A Create project from matching documents window appears.
- Add a name your project if you don’t want to keep the automatic one and optionally add a description.
- Click Create project. Select Send me an email when this project is finished building if you’d like a notification when the project is uploaded. The Create project button turns gray and the project begins uploading.
- Stay in the window until it changes to notify you that your new project is being built.
- Select a concept in the Galaxy or the Active concepts pane to view its concept details.
- The concept appears in the Concept details pane and displays as orange in the Galaxy, while related concepts turn blue and unrelated concepts turn gray.
- Stay in the window until it changes to notify you that your new project is being built.
- Click Back to Projects to view your other projects or click Close to return to your original project.
- Access your new project from the Projects page when it’s done uploading.

