About the data source:
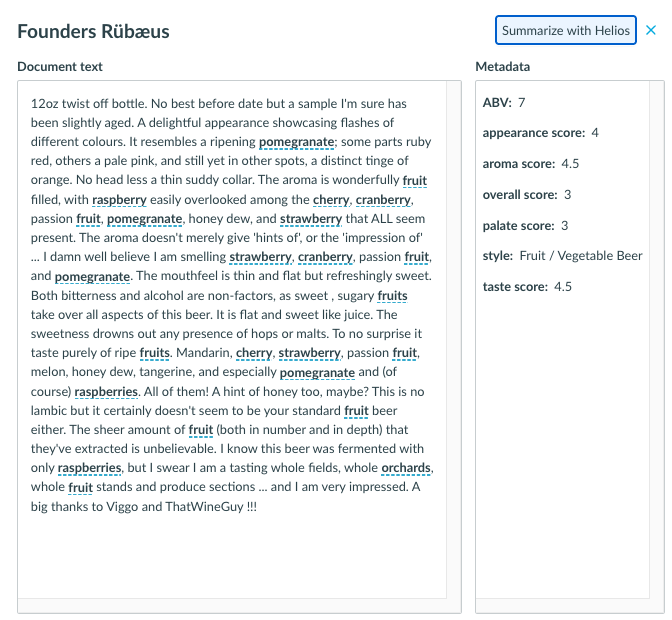
The dataset contains 50,000 reviews collected from beeradvocate.com. Each review includes the name of the beer as the Title, the alcohol by volume percentage (ABV), the style of beer, as well as ratings for appearance, aroma, palate, taste, and an overall score.
This is a classic dataset to start with due to the:
- Number or volume of unique reviews in the dataset
Is this dataset longer than my attention span? YES!
If this dataset only contained a few dozen reviews, I could save time and money by just reading it on my own and referencing the primary sources directly. - The broad vocabulary that is used in the reviews
Is there depth in the natural language that goes beyond “No Comment,” “Service sucked,” or “Too expensive”? YES!
Building a taxonomy around every way someone could describe an IPA versus a Stout would be difficult. We could code by hand or build a taxonomy with Python, but this would be very time-intensive and wouldn’t automatically adapt when new terminology was introduced. Or we could consult a Generative AI/LLM, but the results from that could vary, and it would be difficult to reproduce our findings in the future. - The centralized domain
Is this dataset cohesive around a topic that, as an analyst, I can clearly justify is worth studying? YES!
Whether I want to understand which beers are most popular in a given style, and which styles are most popular compared to others, Daylight allows us to get both quick answers and explore deeper when necessary.
Centralized datasets may include a compilation of data sources, such as support tickets, FAQ articles, interview transcripts, or online forums. The source just needs to contain natural language for Daylight to work with. What makes a domain “centralized” is an identifiable trait that serves as a common thread through each source.
Getting Started: Open the Project
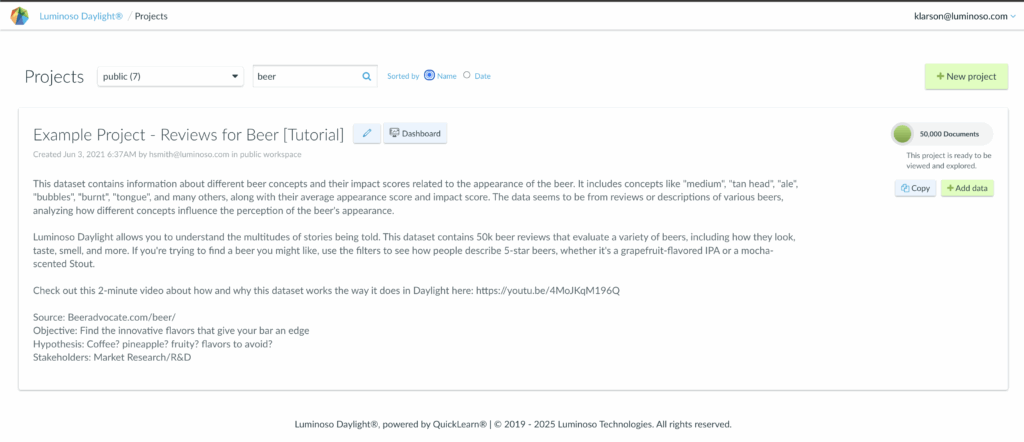
From the project list page, use the search bar at the top to find the “Beer” project, containing 50,000 documents.
Quick Summary from Highlights
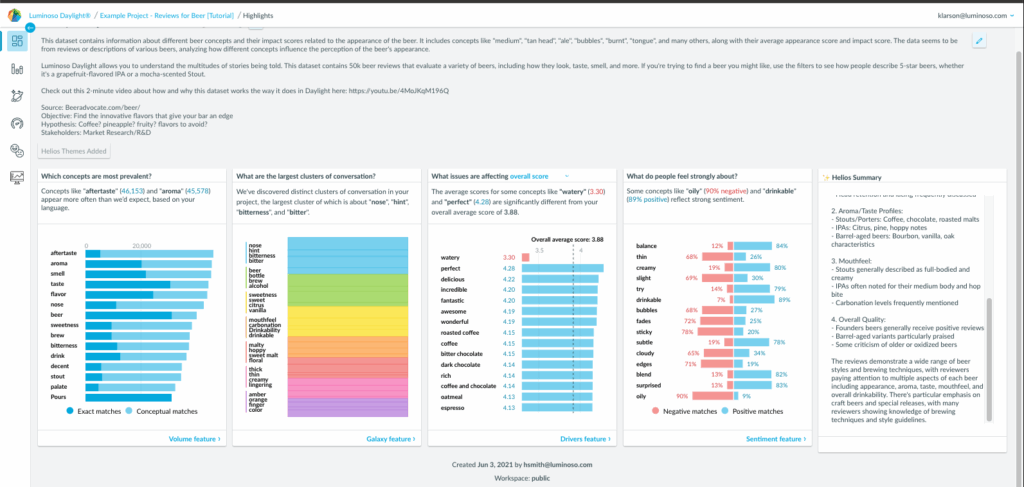
Click on the project name to jump into the project Highlights page. The Helios Summary is included in the last tile. That’s it!
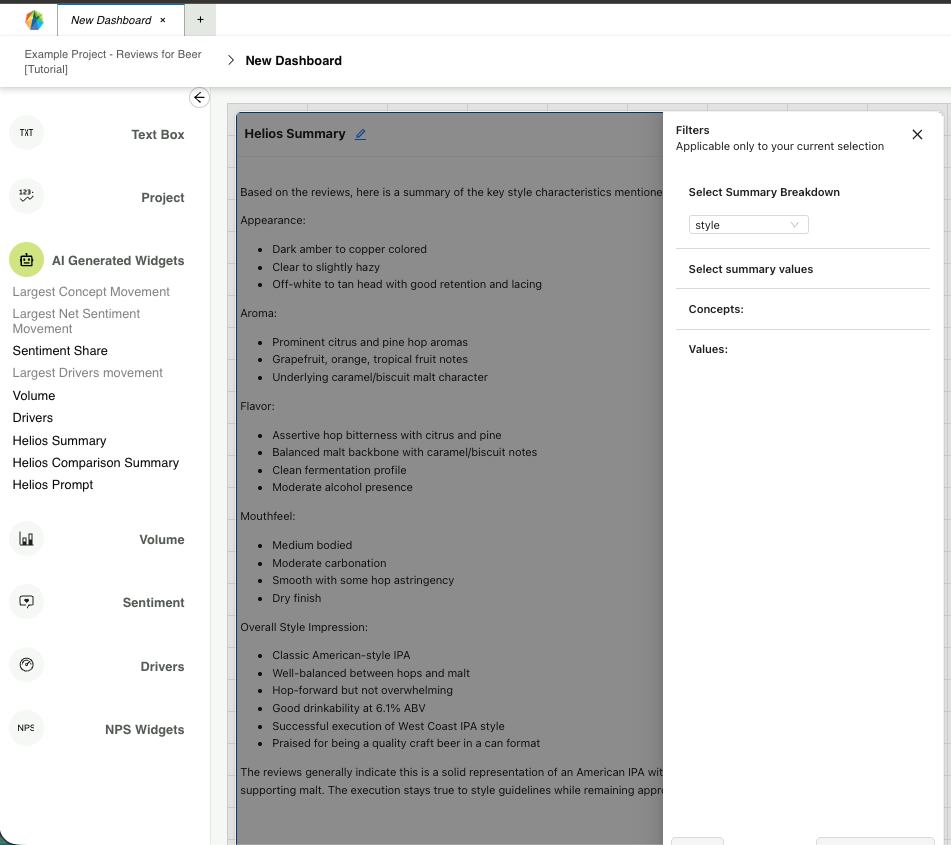
Quick Summary from Dashboard:
Click on the Dashboard icon to the right of the project name:

The dashboard offers a wide variety of widgets to enable your analysis, categorized by function. Open the “AI Generated Widgets” section to find the Helios Summary widget. Go to the filters by clicking on the icon in the top right of the widget to “Select Summary Breakdown.” This will summarize the data with the lens of the metadata field selected.
